Exam (elaborations)
Refining_your_Graphs_VisualAnalytics_Week14_NEC_Solved
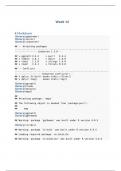
1. look at the first six rows of the asasec dataset 2. plot members v revenue for 2014 in a scatterplot with a confidence interval 3. switch from loess to ols and add the Journal variable 4. show the first six rows of studebt 5. create a faceted comparison of the two distributions - percent of ...
[Show more]