Page 2 out of 15 results
Sort by
Newest Data Visualization summaries
-
Showing_the_Right_Numbers_VisualAnalytics_Week5_NEC_Solved
- Exam (elaborations) • 27 pages • 2023
- $10.49
- + learn more
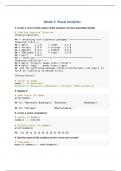
According to the author, 'ggplot is an implementation of the grammar of graphics' which is a set of rules for producing visualizations of data. In this first plot, we will track the trajectory of life expectancy over time for each country in the data. 1. map year to x and lifeExp to y. 2. use geom_line to show how lifeExp changes over time. (did you notice a mistaken assignment to the y parameter in the book?) 3. use grouping to make each line refer to a specific country in the dataset 4...
-
Showing_the_Right_Numbers_VisualAnalytics_Week5_NEC_Solved
- Exam (elaborations) • 27 pages • 2023
- $10.49
- + learn more
According to the author, 'ggplot is an implementation of the grammar of graphics' which is a set of rules for producing visualizations of data. In this first plot, we will track the trajectory of life expectancy over time for each country in the data. 1. map year to x and lifeExp to y. 2. use geom_line to show how lifeExp changes over time. (did you notice a mistaken assignment to the y parameter in the book?) 3. use grouping to make each line refer to a specific country in the...
-
Building_Layered_Visualizations_VisualAnalytics_Week6_NEC_Solved
- Exam (elaborations) • 16 pages • 2023
- $10.49
- + learn more
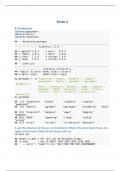
1. get the structure of the gss_sm dataframe. What is the data type of race, sex, region and income? What do the levels refer to? 2. create a graph that shows a count of religious preferences grouped by region 3. turn the region counts in percentages 4. use dodge2() to put the religious affiliations side by side within regions 5. show the religious preferences by region, faceted version with the coordinate system swapped 6. using pipes show a 10 random instances of the first six columns in...
Do you also write study notes yourself? Put them up for sale and earn every time your document is purchased.
-
Visual_Analytics_Week3_Solved
- Exam (elaborations) • 9 pages • 2023
- $10.49
- + learn more
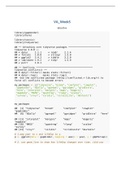
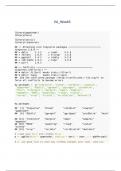
Follow the instructions in the book to create a new project. Give it a name and an author. Execute the 3 code snippets from the preface to bring all the packages into this new project then create a new R Markdown document as instructed by the book. Load the tidyverse and socviz libaries. In order to execute code in an R Markdown object, the code must be enclosed by: ```{r}.....``` Use R studio to complete the following: 1. create a vector of the names of the members of your immediate family ...
-
Visual_Analytics_NEC_All_Weeks_Solved_Week3_to_Week15_Solutions
- Package deal • 13 items • 2023
- $125.49
- + learn more
Visual Analytics All weeks solved from week 3 to week 15. Read the week description and access the right document for that week. Report any errors found and they will be fixed accordingly. Don't share the document, instead share the link to this advertisement.
